Technical Manual

This is the horseshoe, it represents the sensors on the Muse and how they are connected. Solid ovals are good connections. Outlines are poor connection and an empty space means no connection.
For more information on signal quality and how to get a better headband fit, please visit:
https://choosemuse.force.com/s/global-search/fit%20and%20signal%20issues
For help with Bluetooth pairing visit:
https://choosemuse.force.com/s/global-search/bluetooth%20pairing

Tap this icon to cycle through the different graph views.
These are:
Absolute
Raw
Discrete Frequency
Spectrogram
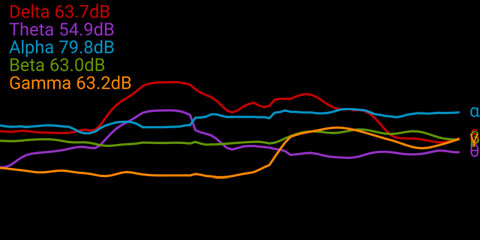
Absolute - Brain wave values are absolute band powers,
based on the logarithm of the Power Spectral Density (PSD) of the EEG
data for each channel.
The frequency spectrums of these are:
Delta(δ) 1-4Hz
Theta(θ) 4-8Hz
Alpha(α) 7.5-13Hz
Beta(β) 13-30Hz
Gamma(γ) 30-44Hz
The EEG PSD values as read from the sensors are commonly in the {-1:+1} range. For the text value display these are shown in a more legible {0:100} range.
For more information visit
https://web.archive.org/web/20181115045420/http://developer.choosemuse.com/tools/available-data#Absolute_Band_Powers
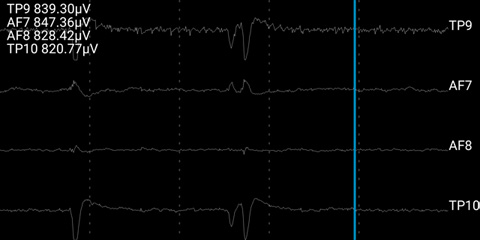
Raw - Raw EEG values show each sensors raw data in microvolts(μV), the range of which is {0:~1682}.
The Vertical Max is adjustable in [Settings], or
by using two finger pinch to zoom in/out. Note that the graph will
automatically center vertically, so for example a set of readings
between {800μV:900μV} would be entirely visible with a vertical scale of
100μV selected.
The sensors are:
TP9 - Left ear
AF7 - Left forehead
AF8 - Right forehead
TP10 - Right ear
AUXR - Right Auxiliary (MU-02/MU-03 only)
Note that the position of AF7 and AF8 will depend on head size. On other heads, these may be closer to FP1 and FP2.
Auxiliary electrodes (enabled via [Settings] > [Show Aux Input]) can be connected on the Muse micro USB connector, by pin 4 on the MU-02 (BlueTooth LE) model.
By default a notch frequency filter of 60Hz for standard US\Canada power, will be applied to raw values. This can be changed via [Settings] > [Advanced Settings] > [Notch Filter] to 50Hz, or disabled.
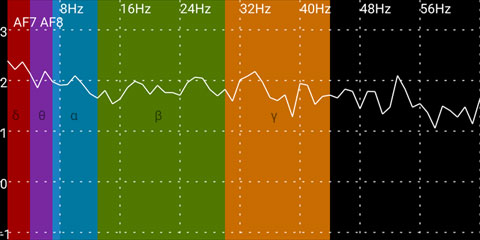
Discrete - Discrete frequency values are on a log scale. These are calculated using a Fast Fourier Transform (FFT) of the RAW data, with a hamming window.
Use two finger pinch to zoom in/out and a single finger touch to pan up/down.
The granularity of the data in this view will depend on the number of raw data samples used, this is called the FFT Window.
[FFT window] is adjustable in [Settings]. Note that high values will take much more processing power.
[FFT Components] in [Settings] lets you select which sensors to include in the calculation.
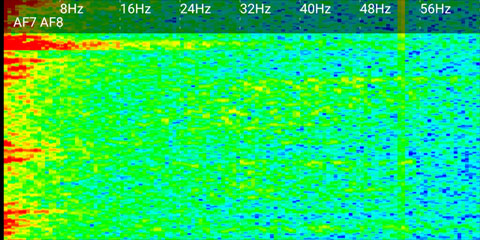
Spectrogram - The spectrogram displays discrete frequency data plotted over time.
Low values are Blue, medium are Green and high values are Red.
Hold a single finger touch to display the live spectrograph data as a coloured bar chart.
Use a two finger touch to adjust the maximum and minimum magnitude range values, to tweak the spectral output. Ranges are also adjustable in [Settings]. The values are the same as used on the discrete frequency graph.
[FFT window] is adjustable in [Settings]. Note that high values will take much more processing power.
[FFT Components] in [Settings] lets you select which sensors to include in the calculation.
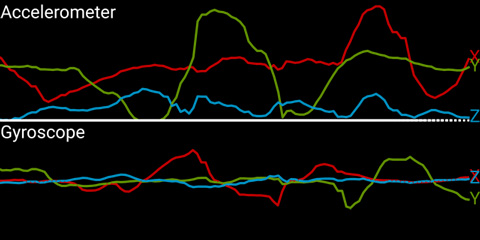
Accelerometer - The effect of gravity on the headband, measured in g (9.81m/s2).
When
the headband is worn on a level head, X will show head tilt up/down, Y
shows head tilt left/right and Z will show vertical motion up/down (e.g.
jumping).
For more information visit:
Gyroscope - The amount of rotation from the last position the headband was in. This will always return to zero.
When
the headband is worn on a level head, X shows head tilt left/right
(Roll), Y shows head tilt up/down (Pitch) and Z shows rotation looking
left/right (Yaw).
For more information visit:

OSC Streaming lets you stream data directly from Mind Monitor to an OSC data receiver such as Interaxon MuseLab. Server IP/Name and Port can be set in [Settings].
When streaming (or recording) you can manually add meta data marker tags by tapping the [Marker Buttons]. [Marker Buttons] are hidden by default and can be turned on in [Advanced Settings].

Recorded files are saved by default as plain text CSV (comma separated values) format, with data being recorded approximately every second.
The following data is recorded: Absolute, Raw (see descriptions above), AUX Right (MU-02 only), Accelerometer, Gyro (MU-02 only), Headband On, HSI (Horse Shoe Indicator / Sensor connectivity), Marker button presses.
You can create graphs of your CSV file recordings, online at Mind-Monitor.com/Chart.php
Recording data to Muse Player compatible protocol buffer format is also supported via [Settings] > [Recording Format] > [Muse].
When using this format it is recommended to set [Settings] > [Recording Interval] > [Constant]. This will create approximately 256 data points per second for RAW values, or ~10/sec for absolute.
To play back the Muse file, run MuseLab. Select "UDP" and enter "5000" for the port number. Click "Open Port".
This makes MuseLab listen on port UDP5000 for incoming data.
Next run Muse Player. Use the "-f" option first to specify the input file and then "-s" to direct the output stream.
The command will look like this: muse-player.exe -f musedata.muse -s osc.udp://localhost:5000
You can now go back to MuseLab and select "Visualizers" > "New" > "Scrolling Line Graph" > "Finish"
Then put a checkbox next to all the data types you wish to display.
For more information please refer to:
https://web.archive.org/web/20181115045420/http://developer.choosemuse.com/tools/windows-tools/muselab-windows
and
https://web.archive.org/web/20181115045420/http://developer.choosemuse.com/tools/museplayer