How to Run Muse-LabOn Mac, with the Finder, navigate to "/Applications/Muse". Double click on the MuseLab icon or "muse-lab.jar". On Windows, navigate to "C:\Program Files (x86)\Muse". Double click on the MuseLab icon or "muse-lab.jar". SetupThis tutorial assumes you have muse-io running with one of the listed presets selected. See the muse-io tutorial for more info.Receiving Data from Muse-IOSet
the receiving port for data then click "Open Port". By default the port
number it is tcp:5000 unless you specified otherwise on the muse-io
command line:  You should start seeing messages show up in the "Incoming Messages" box:  Setting up a Scrolling Graph VisualizerNow that you are receiving data, it's time to visualize it. Change to the "Visualizer" tab:  Click on the "New" button:  Choose the "Scrolling Line Graph", then click "Finish":  The left side of the screen should now look something like this:  We
will create a graph of your raw brainwaves. In the "Signal Group
Options" box, check the "Draw" box for "/muse/eeg/raw":  You will see data start to scroll across the screen. Adjust
the amplitude of the signal by going to the "Settings" tab and changing
the range from -1250 to +1250 (you can use the up and down arrows to do
this):   Let's label this graph "EEG":  Let's
change the names of the channels that show up on the graph. Go back to
the "Signals" tab and double-click on "/muse/eeg/raw (0)":  Change the name to "Left Ear", notice that the name on the graph changes:  You can go ahead and change each of the raw EEG labels with its corresponding English name. See OSC Pathing Scheme to see the head location for each signal. Load the Configuration FileOnce MuseLab loads up, go to "Configuration -> Load Configuration" and open the file called "preset-14-4ch-acc.json". This file will work if you are running muse-io with the “14” preset. It will take a few seconds to load this file.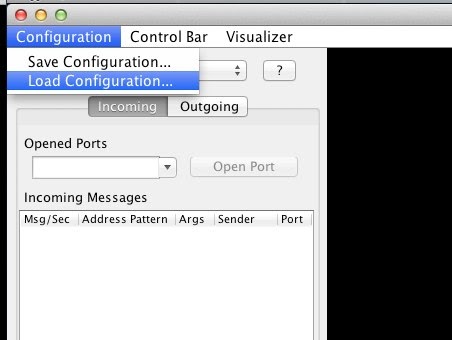
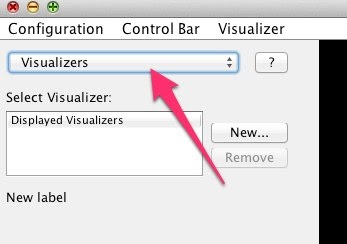
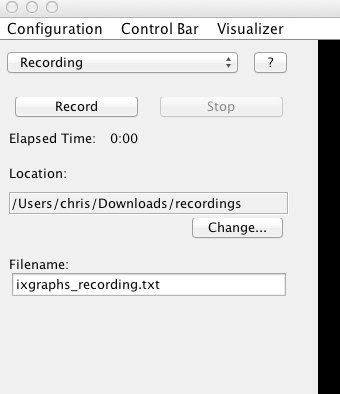
What the data should look once you are receiving clean EEGIn the screenshot below, the setup has the four EEG channels in the top graph. Channels (1) and (4) show three eye blinks. The middle plot shows the two AUX channels, ECG is visible from auxiliary chest electrodes. The bottom plot shows the three accelerometer axes.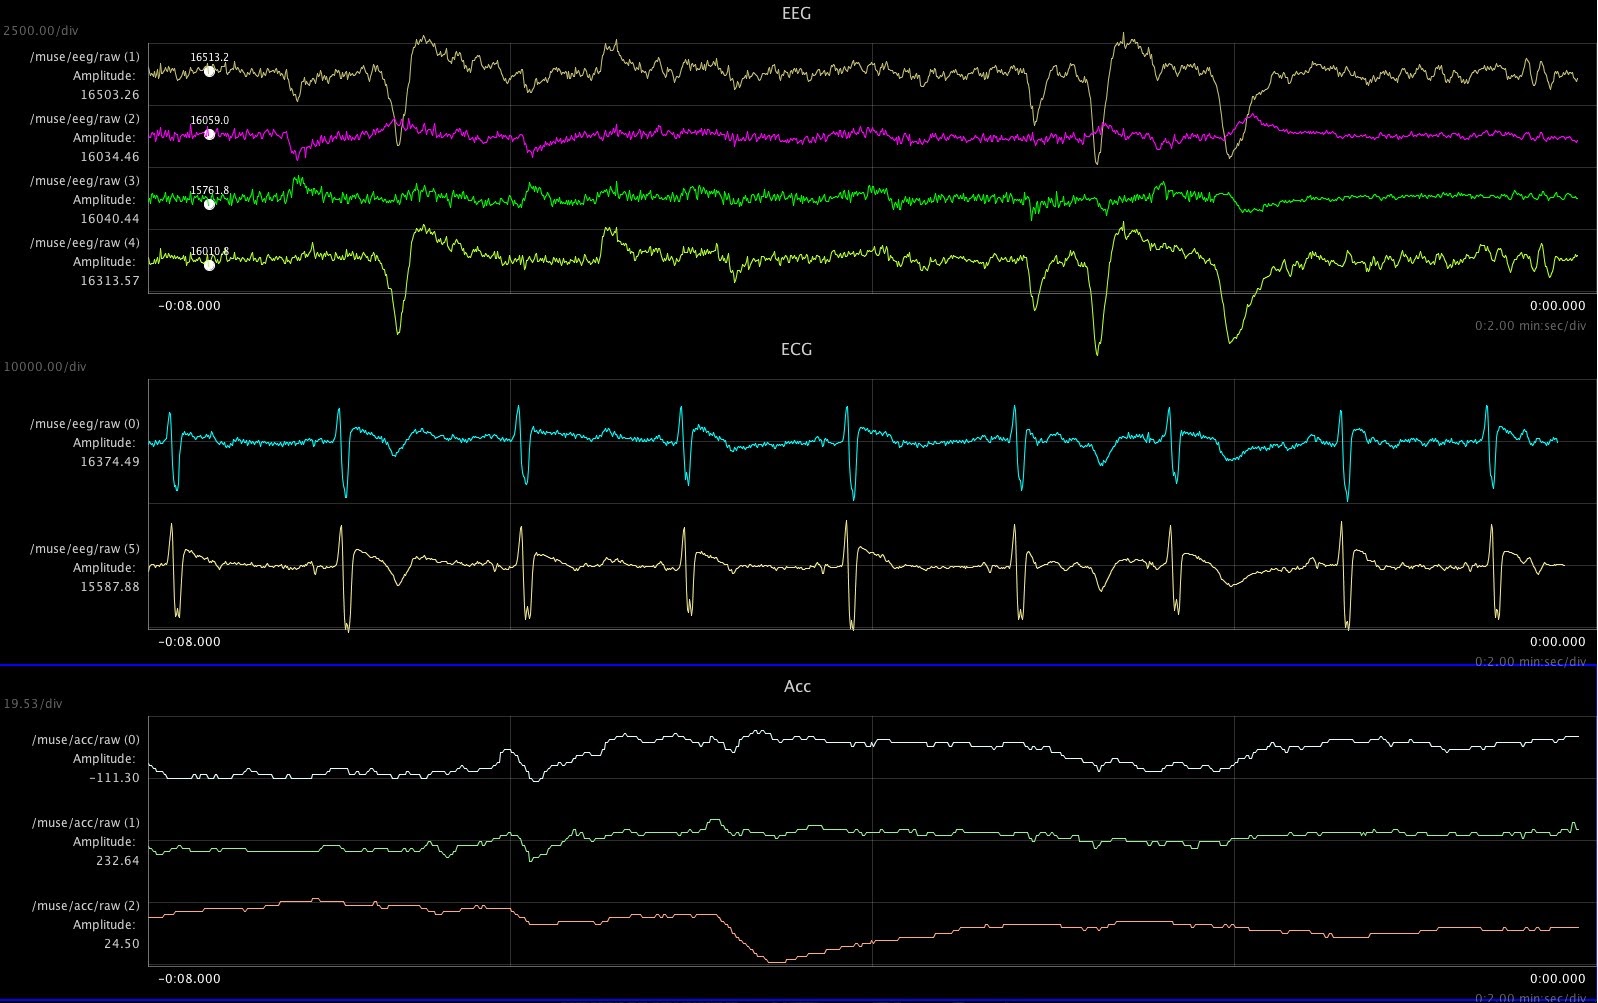 Tricks for using MuseLab1. If you click on a graph (it will highlight in blue). You can change the plot vertical scale and time scale using the arrow keys.2. You can delete / modify / create plots by selecting “Visualizers”: 3. Recording of data is available in the recording screen:
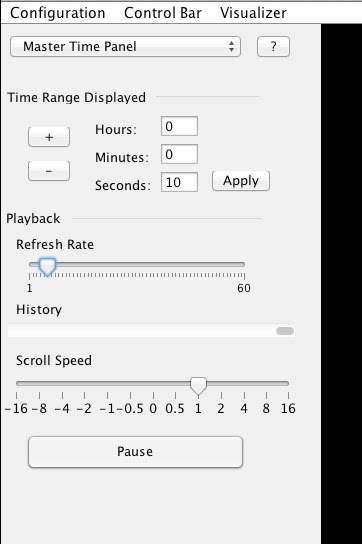
4. In the Master Time Panel, frame rate can be adjusted to make the graph update less frequently. Also you can Pause and Fwd / Rev scroll.
5. In the Markers panel, you can define and add markers into the current recording. Markers are also visible in the plot window. 6. In the DSP Settings panel you can define and apply FIR, IIR, and AX+B filters. 7. In the OSC panel, you can see the incoming messages as well as open and close UDP ports. Incoming Data FormatFor an description of the incoming signals from Muse, click here. |
MuseLab >